Trading is a game of probability. This means that every trader will be wrong sometimes. When a trade does go wrong, there are only two options: to accept the loss and liquidate your position, or go down with the ship.
Hard Stop
One of the simplest stops is the hard stop, in which you simply place a stop a certain number of pips from your entry price. However, in many cases, having a hard stop in a dynamic market doesn't make much sense. Why would you place the same 20-pip stop in both a quiet market and one showing volatile market conditions? Similarly, why would you risk the same 80 pips in both quiet and volatile market conditions?
To illustrate this point, let's compare placing a stop to buying insurance. The insurance that you pay is a result of the risk that you incur - whether it pertains to a car, home, life, etc. As a result, an overweight 60-year-old smoker with high cholesterol pays more for life insurance than a 30-year-old non-smoker with normal cholesterol levels because his risks (age, weight, smoking, cholesterol) make death a more likely possibility. If volatility (risk) is low, you do not need to pay as much for insurance. The same is true for stops - the amount of insurance you will need from your stop will vary with the overall risk in the market.
ATR % Stop Method
The ATR% stop method can be used by any type of trader because the width of the stop is determined by the percentage of average true range (ATR). ATR is a measure of volatility over a specified period of time. The most common length is 14, which is also a common length for oscillators such as the relative strength index (RSI) and stochastics. A higher ATR indicates a more volatile market, while a lower ATR indicates a less volatile market. By using a certain percentage of ATR, you ensure that your stop is dynamic and changes appropriately with market conditions.
For example, for the first four months of 2006, the GBP/USD average daily range was around 110 to 140 pips. A day trader may want to use a 10% ATR stop - meaning that the stop is placed 10% x ATR pips from the entry price.In this instance, the stop would be anywhere from 11 to 14 pips from your entry price. A swing trader might use 50% or 100% of ATR as a stop. In May and June of 2006, daily ATR was anywhere from 150 to 180 pips. As such, the day trader with the 10% stop would have stops from entry of 15 to 18 pips while the swing trader with 50% stops would have stops of 75 to 90 pips from entry.
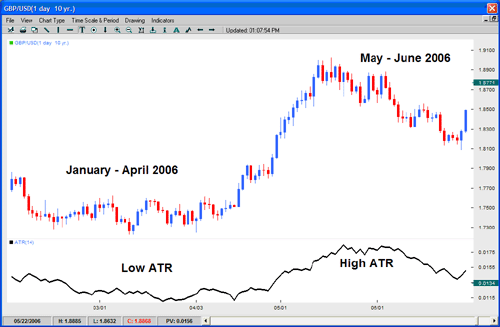 |
| Figure 1 Source: FXTrek Intellichart |
It only makes sense that a trader account for the volatility with wider stops. How many times have you been stopped out in a volatile market, only to see the market reverse? Getting stopped out is part of trading. It will happen, but there is nothing worse than getting stopped out by random noise, only to see the market move in the direction that you had originally predicted.
Multiple Day High/Low
The multiple day high/low method is best suited for swing traders and position traders.It is simple and enforces patience but can also present the trader with too much risk. For a long position, a stop would be placed at a pre-determined day's low. A popular parameter is two days. In this instance, a stop would be placed at the two-day low (or just below it). If we assume that a trader was long during the uptrend shown in Figure 2, the individual would likely exit the position at the circled candle because this was the first bar to break below its two-day low. As this example suggests, this method works well for trend traders as a trailing stop.
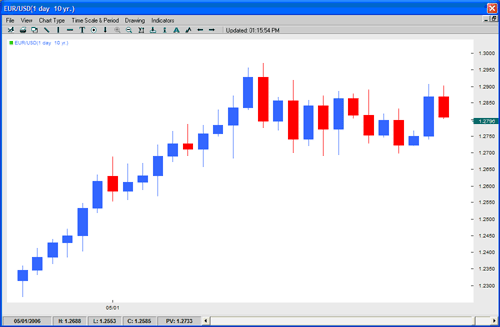 |
| Figure 2 Source: FXTrek Intellichart |
This method may cause a trader to incur too much risk when they make a trade after a day that exhibits a large range. This outcome is shown in Figure 3, below.
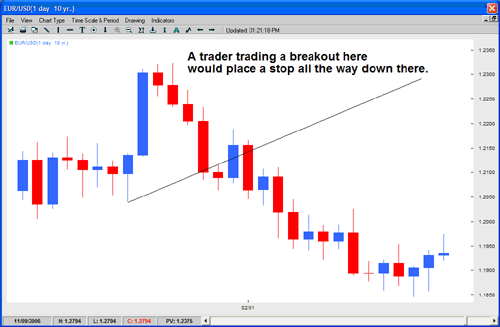 |
| Figure 3 Source: FXTrek Intellichart |
A trader who enters a position near the top of the large candle may have chosen a bad entry but, more importantly, that trader may not want to use the two-day low as a stop-loss strategy because (as seen in Figure 3) the risk can be significant.
The best risk management is a good entry. In any case, it is best to avoid the multiple day high/low stop when entering a position just after a day with a large range. Longer term traders may want to use weeks or even months as their parameters for stop placement. A two-month low stop is an enormous stop, but it makes sense for the position trader who makes just a few trades per year.
Closes Above/Below Price Levels
Another useful method is setting stops on closes above or below specific price levels.There is no actual stop placed in the trading software - the trade is manually closed out after it closes above/below the specific level. The price levels used for the stop are often round numbers that end in 00 or 50. As in the multiple day high/low method, this technique requires patience because the trade can only be closed at the end of the day.
When you set your stops on closes above or below certain price levels, there is no chance of being whipsawed out of the market by stop hunters. (Want to do some stop hunting of your own? Check out Stop Hunting With The Big Players.) The drawback here is that you can't quantify the exact risk and there is the chance that the market will break out below/above your price level, leaving you with a big loss. To combat the chances of this happening, you probably do not want to use this kind of stop ahead of a big news announcement. You should also avoid this method when trading very volatile pairs such as GBP/JPY. For example, on December 14, 2005, GBP/JPY opened at 212.36 and then fell all the way to 206.91 before closing at 208.10. A trader with a stop on a close below 210.00 could have lost a good deal of money. This is shown in Figure 4, below.
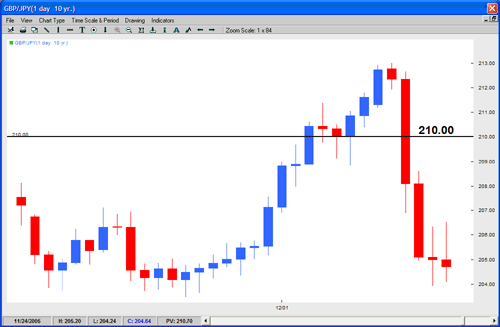 |
| Figure 4 Source: FXTrek Intellichart |
Indicator Stop
The indicator stop is a logical trailing stop method and can be used on any time frame. The idea is to make the market show you a sign of weakness (or strength, if short) before you get out. The main benefit of this stop is patience. You will not get shaken out of a trade because you have a trigger that takes you out of the market. Much like the other techniques described above, the drawback is risk. There is always a chance that the market will plummet during the period that it is crossing below your stop trigger. Over the long term, however, this method of exit makes more sense than trying to pick a top to exit your long or a bottom to exit your short. How many times have you exited a trade because RSI crossed below 70 only to see the uptrend continue while RSI oscillated around 70? In this example, we used the RSI to illustrate this method, but many other indicators can be used. The best indicators to use for a stop trigger are indexed indicators such as RSI, stochastics, rate of change or the commodity channel index. Figure 5 shows a GBP/USD hourly chart.
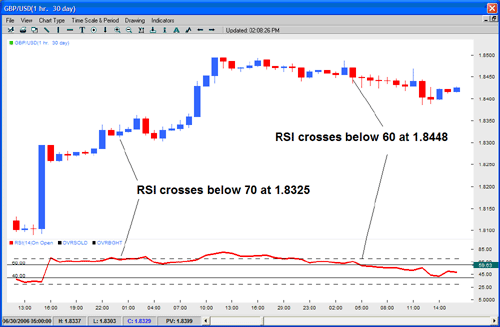 |
| Figure 5 Source: FXTrek Intellichart |
Summary
In order to use stops to your advantage, you must know what kind of trader you are and be aware of your weaknesses and strengths. For example, maybe you have great entry methods but have a problem exiting the trade too early. If so, you may want to work with an indicator stop. Every trader is different and, as a result, stop placement is not a one-size-fits-all endeavor. The key is to find the technique that fits your trading style - once you do, exiting failing trades should be smooth sailing.
0 comments:
Post a Comment